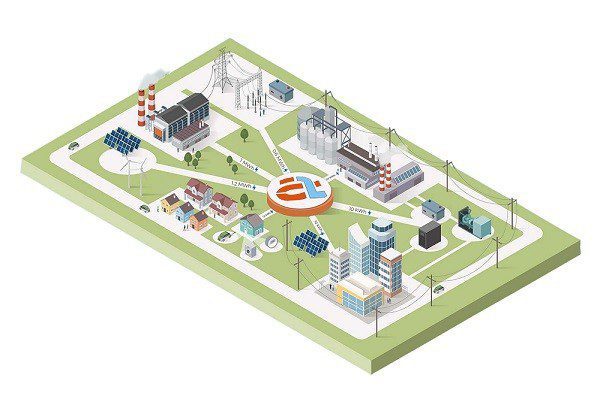
Actwin Smart Energy Management Software; automatically collects information from devices similar to the one below. Usually, this data includes consumption, analysis, status, and warning information. Actwin Smart Energy Management Software is an energy management software that enables the creation of reports, warnings, estimates, and invoices based on the data that it collects.
- Electricity Meters,
- Gas Meters
- Water Meters,
- Wastewater Meters,
- Steam Meters,
- Calorimeters,
- Energy analyzers
- Electronic Volume Collectors
- Flowmeters
In general; It is used in institutions operating in more than one location such as Organized Industrial Zones (OSB), Shopping Malls (AVM), Housing Projects, Tourism Complexes, Industrial Facilities, and Retail Sector.
Institutions such as EMRA, EPİAŞ, and the Ministry of Finance are constantly monitored and updated to ensure full compliance with the regulations.
The ever-increasing energy requirements and costs conduct all our institutions to consume more sensitively and to make necessary savings for our future. At this point, Actwin Smart Energy Management Software emerges as an Energy Monitoring and Management Software equipped with powerful capabilities for Industrial and Commercial Enterprises.
Actwin Smart Energy Management Software monitors analyze usage habits, and creates a roadmap for when, where, and how users can save energy resources. The Energy Market Regulatory Authority (EMRA) and its regulations have a primary priority in the preparation of this roadmap.
As Peter F. Drucker said "If you can't measure it, you can't manage it."
Please use the Live Support page or Contact Form for more information.
General Features
The general features of Actwin Smart Energy Management are listed below:
- Multi-language support
- Compatibility with widely used and secure databases such as Microsoft SQL and Oracle
- Distributed architectures such as “server,” “client,” and “web” interfaces
- The server is the main engine that runs in the background to collect data from devices
- The client is the application component where management is performed through interaction with the server. Both the server and client interfaces are desktop applications
- The web interface allows users (such as factories) to log in to the system to monitor their own devices’ energy consumption and power quality, and generate reports
Communication
Actwin Smart Energy Management features a modular architecture designed to accommodate new protocols that may be added in the future. The supported protocols are as follows:
Communication Protocols:
- IEC 62056-21 Mode C and fixed baud rate
- DLMS/Cosem
- Modbus-RTU
- Modbus-TCP/IP
- M-Bus
- Wireless M-Bus
Communication Interfaces:
- Serial communication (RS485, RS232)
- GPRS
- M-Bus
- Ethernet
- PLC (DLC)
- RF
The communication principle supports both “push” and “pull” architectures. Data collection timing and the time at which data is recorded in the database can be defined, and the measurement parameters to be read from each device can be set independently.
The Actwin communication module automatically starts as a Windows service when the server is launched. This prevents users from accidentally closing the data collection application.
Reporting
Reports of the following types can be generated using the collected data. Thanks to its modular structure, new reports can be easily added to the software as needed. There is no need to upgrade or modify the Actwin software when a new report is requested.
- All reports can be exported in MS Excel, MS Word, HTML, and PDF formats:
- Tabular reporting of measurements from all selected devices
- Graphical display of measurements from a specific device (multiple devices can be shown on the same graph)
- Comparison of measurement points using algorithms such as consumption and average values
- Active and reactive energy ratio reports for electricity meters
- Electricity meter consumption reports based on energy tariffs
- Distribution network load reports (transformers, gas stations)
- Daily, monthly, and annual consumption reports
- Display of measurement points on a map, filtered by reactive energy, low consumption, and loss/theft conditions
- Transformer loss report
- Monthly/annual total distribution network consumption report, import/export comparison
- Gas component reports
- Natural gas minimum/maximum hourly/daily consumption report
- Measurement point inventory report
- Communication performance report
- Low/excessive consumption report for water meters
Single-Line Diagram
Just as in SCADA systems, electrical distribution networks can be represented using single-line diagrams. Information regarding devices such as electricity meters and secondary protection relays can be monitored on these diagrams:
- Power, current/voltage values
- On/off statuses of secondary protection relays
- Filter contamination and door/valve statuses for Type B and C stations
Supported features:
- Drag-and-drop support
- An unlimited number of screens can be created
Loss/Theft Detection
Loss/theft reports can be generated manually or automatically. Automatically generated reports can be sent via email to designated recipients:
- Electric meter parameters (events, current/voltage/power/power factor/phase angle, etc.) can be continuously monitored
- Unexpected consumption discrepancies between the main distribution points and connected points are detected
- Interventions on the meter and panel cover are detected and reported to operators
Data Validation
Metering data must be validated prior to billing and reporting. This validation is performed using the following methods:
- Is the reading within the specified limits?
- Ratio of the reading to consumption in previous periods
- Current status compared to recent readings
- Compliance with the standard deviation based on average values
- Consistency between the unit of measurement and the reading value
Integration
Seamless connectivity with other systems—such as ERP, accounting, geographic information, and banking systems—can be established via web services.
Subscriber Management
Reports can be generated from all information stored in the database. Users or measurement points can be easily defined using the copy-paste method. There are no limits to the information that can be defined in measurement point and customer records. Predefined information:
- Customer number
- Username
- Address/parcel information
- User type
- Service start date
- Authorized person
- Contact information such as phone, fax, and email
- GPS coordinates
Reports can be generated, grouped, listed, and filtered using this information.
Web Interface
Actwin’s web interface allows customers to monitor their own consumption and energy quality parameters. Access is granted via a username and password. Each user can access only their own measurement points. For security reasons, the internet connection does not connect directly to the database; a secure web service layer exists between the web interface and the database:
- Users can view historical measurements
- View general and specific messages from management
- Natural gas consumers can submit their forecasts to the system
- Receive alerts regarding reactive power penalties, maximum demand overages, and gas consumption limits
Alarm Management
- Event logs from measurement devices can be recorded in the database and reported
- Reactive power consumption is monitored, and users are notified via email or SMS when limits are approached
- Sent email and SMS notifications are recorded in the database
Authorization
- User roles can be created in the system with predefined permissions
- Users can be defined and assigned to specific roles
- Authorisation can be configured on a measurement point basis
Software Modules
- Communication and Data Validation
- Reporting
- Billing
- Loss/Theft Detection
- Single-Line Diagram and Map Display
- Web Service Integration
- Alarm Management, SMS and Email Notification
- Web Interface
- User and Inventory Management
- Authorization
| Type | Size | Download Link | |
| ACTWIN - Actwin Smart | 1 MB | Download |